logo
WORK WITH US
  • Home
  • Information Design
  • Case Studies
  • Insight
  • About Us
  • Contact
logo
  • Home
  • Information Design
  • Case Studies
  • Insight
  • About Us
  • Contact
Insights Visualisation31st January 2018

How to show multiple datasets

By Non Wood

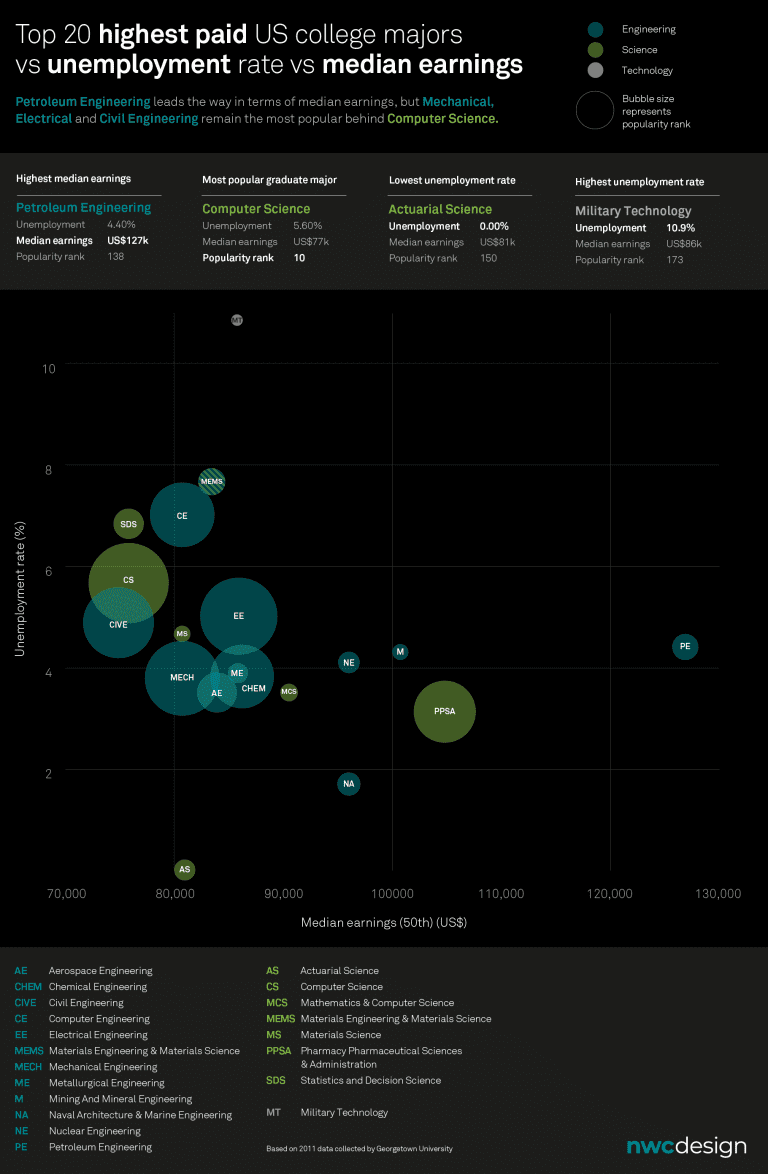
A little something I’ve been working on whilst waiting for some content through for client projects. I wanted to play around with showing 3 data sets on the same chart. Why didn’t I go into Petroleum Engineering?!

Charts, Data Visualisation, Infographics
Previous A day in the life of an information designer
Next An Interview with Peter Lippitt

Related Posts

professional-graph-design

5 tips for professional graph design

26th July 2019

Top 3 scientific rules for effective information design

4th November 2015

5 reasons why infographic designs are perfect for internal communications

13th February 2019

How to create a ‘good’ infographic (+FREE template)

4th July 2019
  • About NWC Design

    NWC Design is a creative agency specialising in information design for the digital publishing world. Based in the North-west of England we work with clients all over the globe, adding value to their unique content through engaging visual design.
  • Recent Posts

    5 reasons for using a content design agency
    Insights, Visual Content
    A beginner’s guide to microcontent
    Editorial Design, Insights, Visual Content
    Visual content: 10 ways
    Insights, Visual Content
  • Quick Links

    • Home
    • Information Design
    • Case Studies
    • Insight
    • About Us
    • Contact
  • GET IN TOUCH

    Give us a call
    01606 276 176

    Email Us
    workwithus@nwc.design

© NWC Information Design Ltd 2020. Company registered in England and Wales, no. 11327280 • Web services - design|dylunio